Visual Basic for Applications
Back in August, I learned that with Microsoft Office products (i.e. Word, Excel, Access) you can write your own macros to help automate repetative tasks or create your own needed office functions that are not standard with office products to improve your workflow. I give props to Microsoft, because I have definitely been frustrated at times and wishing for more functionality from their products, but I understand they reach a global market and it is not possible to program everything people need in their products. Instead Microsoft gives you the tools to customize your own Office products with the Visual Basic for Applications programming language (VBA).
I often use Excel for work and I wanted to see if I could learn VBA and implement my own macro someday. I found WiseOwl online when googleing (googling? You know what I mean…) for resources and started working through their Excel VBA exercises. Going through the exercises helped me tremendously and I was able to start writing macros in no time. Then in september, I got my opportunity to apply what I learned for a real-world project at work.
Implementing My First VBA Solution
I was given a project where I had to help verify a client’s count of aggregated data for state reporting. Usually, aggregating data requires little effort and does not take much time when you have a right data system in place. However, this client had to collected and report data from 14 of their funded programs and to manage the data, the client was in contract with a software company (hereinafter referred to as “SC”) that let the funded programs to submit their data online.
While this sounds convenient, it turned out to be a huge mess. The SC made what should be simple tasks difficult. To be fair, it could have been the client I was working with did not set up their system properly with SC, but having to navigate the software myself I think the SC could do with some major improvements.
Long story short, you could not aggregate the data through their software and I had to manually export all the data for each program to Excel. When I opened up the Excel files, I was met with more headaches. For some reason, the SC exported data as shown below.
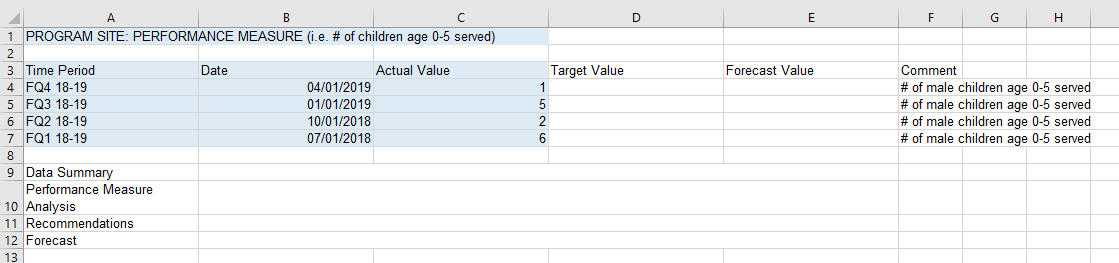
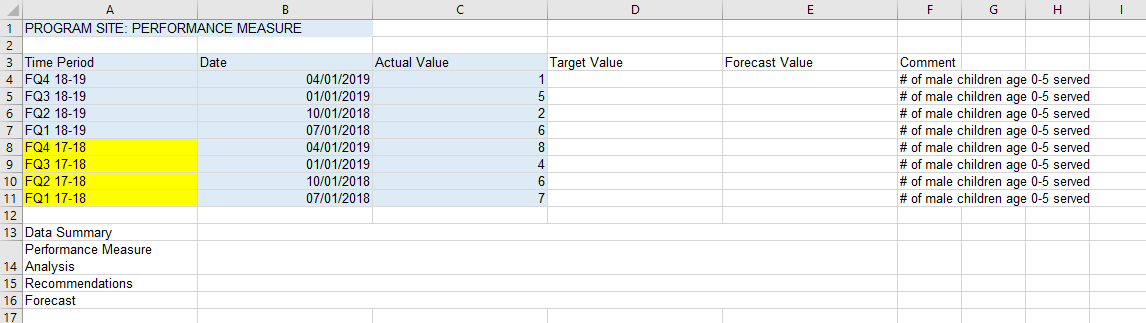
Sheet 1: Export Format
I removed the program site for confidentiality and included randomn numbers for data but I highlighted the data that I needed in sky blue. Now let’s review some of the issues I had with this data.
Issue #1
The data I had to aggregate was the program site, performance measure (which for some reason was repeated under comment), time period, date, and actual value. Everything else was unneccessary. I was hoping everything was organized into a simple table which was entirely possible, but SC chose to use a custom structure that wrapped the table with clutter.
Issue #2
All programs reported the same number of performance measures, but SC exported all performance measures on individual spreadsheets. This meant each (14) program workbook had 114 sheets and I would have to review a total of 1596 sheets with data.
Issue #3
The third headache, was dealing with missing data. In this context, an empty cell meant that the program did not anything to report. Sometimes no data was reported for specific time periods as shown below and highlighted in yellow.
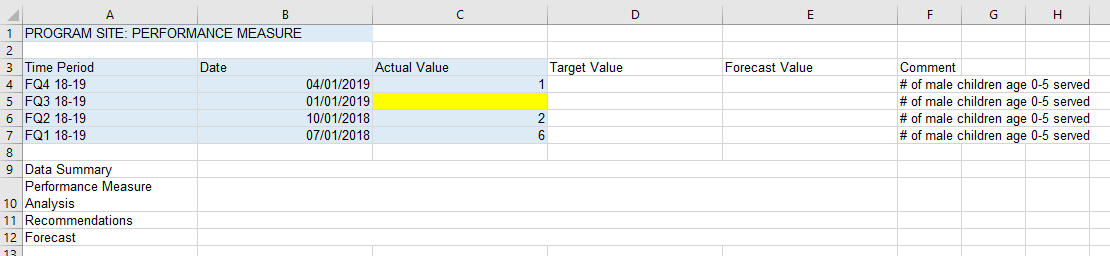
Sheet 2: No Data Reported For One Time Period
Other times, there was no data reported for the entire program year on certain performance measures but we were at least given the time periods in the spreadsheets to indicate nothing to report.
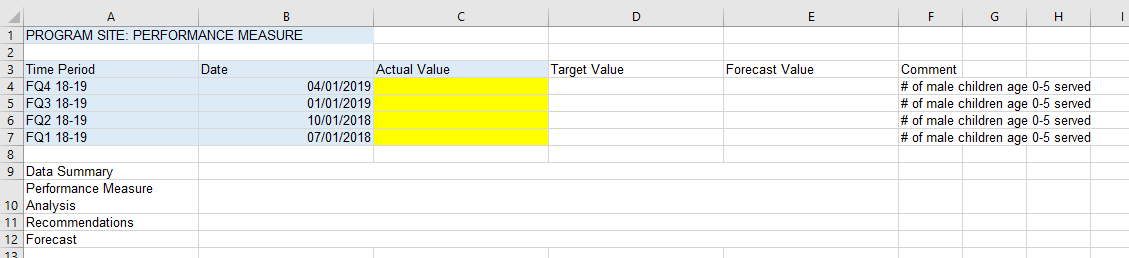
Sheet 3: No Data Reported For The Year
But then other times, SC would export spreadsheets with everything missing. SC was inconsistent between including time periods even if there was no data to report.
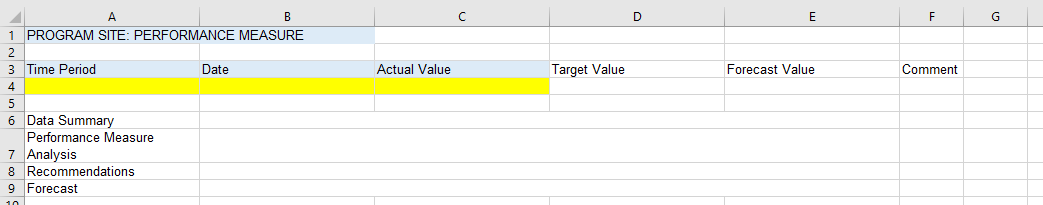
Sheet 4: Everything is Missing
Issue #4
Finally, some programs had data from previous years that were also included. For this project, we only needed to aggregate the 18/19 program year.
Sheet 5: Data for Past Years Included
Macro Solution
What I wanted was to compile all the data across all 114 spreadsheets into one sheet. That way I could then create a pivot table to aggregate my final counts. Without the macro the only way to accomplish this would have to go back and forth through each sheet copying and pasting the data I needed. I was not about to spending my time doing this for a total of 1596 sheets.
Thus the macro below was born:
Sub Aggregate()

    ' Create Variables '
    Dim i As Integer
    x = Sheets.Count - 1

    Dim pM As Long
    Dim lastRow As Long
    Dim ST As Worksheet
    Dim dB As Worksheet
    Set dB = Sheets(Worksheets.Count)

    For i = 1 To x
        If Not IsEmpty(Sheets(i).Range("A4")) Then
            Set ST = Sheets(i)

            ' This is to copy and paste Time, Date, and Actual Value '
            ST.Range(ST.Cells(4, 1), ST.Cells(4, 1).End(xlDown).Offset(0, 2)).Copy

            ' Paste the copy '
            dB.Cells(Rows.Count, 2).End(xlUp).Offset(1, 0).PasteSpecial

            ' Copy the performance measure '
            ST.Cells(1, 1).Copy

            ' Paste performance measure '
            pM = dB.Cells(Rows.Count, 1).End(xlUp).Offset(1, 0).Row
            lastRow = dB.Cells(Rows.Count, 2).End(xlUp).Row

            dB.Cells(Rows.Count, 1).End(xlUp).Offset(1, 0).PasteSpecial
            dB.Range("A" & pM).AutoFill Destination:=dB.Range("A" & pM, "A" & lastRow), Type:=xlFillCopy

        End If
    Next i

End Sub
The macro is a standard “for” loop. In sum it goes through every sheet copying the data I needed and pasting it into one sheet for me. In less than 10 seconds I got what I wanted for each program site.
Conceptually, the macro I wrote does the following using sheets 1-5 from above as an example:
- Create variables that I need to keep track of progress while inside the loop.
- Initiate the loop.
- Starting at the first sheet, check if cell A4 is empty. If the cell was empty that meant there was nothing to report and to go on to the next sheet. This addressed issue #4.
- If A4 was not empty, select and copy everything from cell A4 down until reaching a blank cell and then continue selecting the 2 columns to the right. This will get us most of the data we need for time period, date, and actual value. The gif helps us visualize what Excel does in this step.
- After selecting cells A4:C4, copy and paste the cell values into a table found on a new sheet at the end of the workbook. In our new table the data is pasted to columns B to D. The data will be pasted starting at the bottom of the table in the first empty row to prevent previous pasted data from being overridden.
- The loop then goes back to the same sheet to copy the remaining “PROGRAM SITE: PERFORMANCE MEASURE” cell and paste it into our new sheet, column A.
- The previous step also requires to fill down the performance measure to match the number of rows copied from step 5.
- After the previous steps are completed, the loop moves onto the next sheet. The final output looks like below. Note: I also included an extra column named “Sheet” to help you keep track since performance measure all look the same for this example. In the real application performance measure varied.
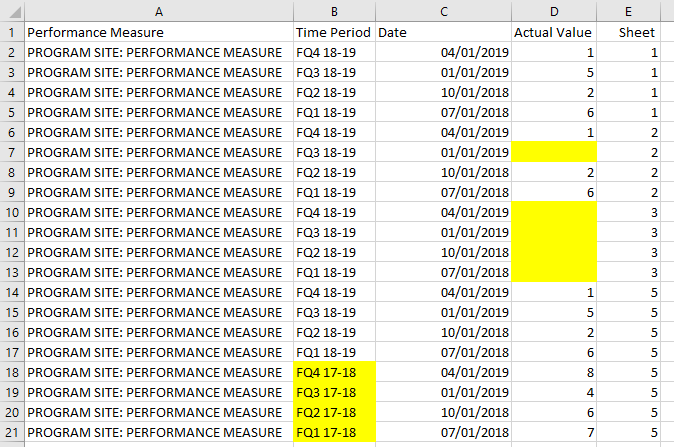
Output: Compiled Data Table
The final output is a lot closer to how I wished SC would export their data. With a table in this format, analysis is a breeze. I eventually did make a pivot table to help me complete my original task of verifying the total counts but before I did, I had to do a little more manual cleaning outside of the macro.
First, I split the performance measure column A into two columns; program site and performance measure. This is a better practice to manage our data and once we have a pivot table we could then filter by either column. Second, I didn’t escape having to do some manual copying and pasting. The macro compiled the data only with each exported program workbook, but not across the workbooks. I did not feel ready to add this level of complexity in my macro and I was also on a deadline. I didn’t mind having to copy and paste only 14 sheets compared to the original 1596 sheets. My final table had all 14 programs in one file.
Don’t Program?
Overall, I was very proud of myself for finding a solution to complete my work in an efficient manner. Without the macro this task could have taken a couple of days, but I got it done in under one. The satisfaction of finding solutions to problems by being able to program is an unmatched when I work and it is also when I am most engaged. That being said, I know not everyone is interested in programming. If at anytime someone is curious about trying to automate a task, feel free to reach out to me. I would love the experience and am always glad to help others out. The task could be related to VBA and Excel or other platforms and languages.